

table of contents
Wondering how much PPC advertising will set you back? Most businesses in the U.S. pay between $0.50 and $5.00 per click, though your exact spend hinges on platform and industry. At its core, PPC breaks down into three cost models—CPC, CPM, and CPA—that shape where your budget goes.
Quick Answer On Cost Of PPC Advertising
PPC expenses come down to how you pay:
- CPC (Cost Per Click): You pay each time someone clicks—usually $1–$2 on major platforms.
- CPM (Cost Per Thousand Impressions): You’re billed per 1,000 views, often $5–$10.
- CPA (Cost Per Acquisition): You only pay when a visitor converts, with rates commonly $20–$50.
Below is a quick reference for the main PPC cost metrics, their meanings, and average ranges.
Summary Of PPC Cost Metrics
| Metric | Definition | Typical Range |
|---|---|---|
| CPC | Cost Per Click | $0.50–$5.00 |
| CPM | Cost Per Thousand Impressions | $2–$12 |
| CPA | Cost Per Acquisition | $10–$100 |
This snapshot helps you decide where to direct your budget—whether you’re chasing clicks, impressions, or actual conversions.
For instance, an e-commerce retailer might zero in on CPA to maximize sales, while a new brand often leans on CPM to build awareness.
Primary PPC Cost Models
Think of CPC like buying individual movie tickets—you only pay when someone shows up.
“CPM is the digital equivalent of a roadside billboard: you’re buying eyeballs by the thousand.”
And CPA feels like handing over cash only after the customer walks through the door.
Typical Cost Benchmarks
Bidding wars in crowded industries drive prices up, while niche markets or local campaigns usually enjoy lower rates. A law firm might see average CPC near $9, whereas a neighborhood coffee shop could pay under $1 per click.
Key factors that influence your costs include:
- Competition Level: More bidders, higher prices.
- Keyword Match Type: Broad matches cost more; exact matches tend to be cheaper.
- Quality Score: Well-aligned ads and landing pages can reduce your CPC.
- Seasonality & Device Targeting: Peak seasons and mobile bids often command a premium.
Next Steps For Budget Planning
Use this framework to shape your first campaign bids:
- Estimate monthly click volume through keyword research.
- Multiply expected clicks by your target CPC to forecast spend.
- Project conversions based on your average conversion rate.
- Tweak your budget until you hit your desired CPA and ROI.
Keep these principles in mind when you launch campaigns in Google Ads, Microsoft Advertising, or social channels. Each platform follows the same basic cost logic—once you understand CPC, CPM, and CPA, you’re ready to plan effectively.
Understanding Key PPC Metrics
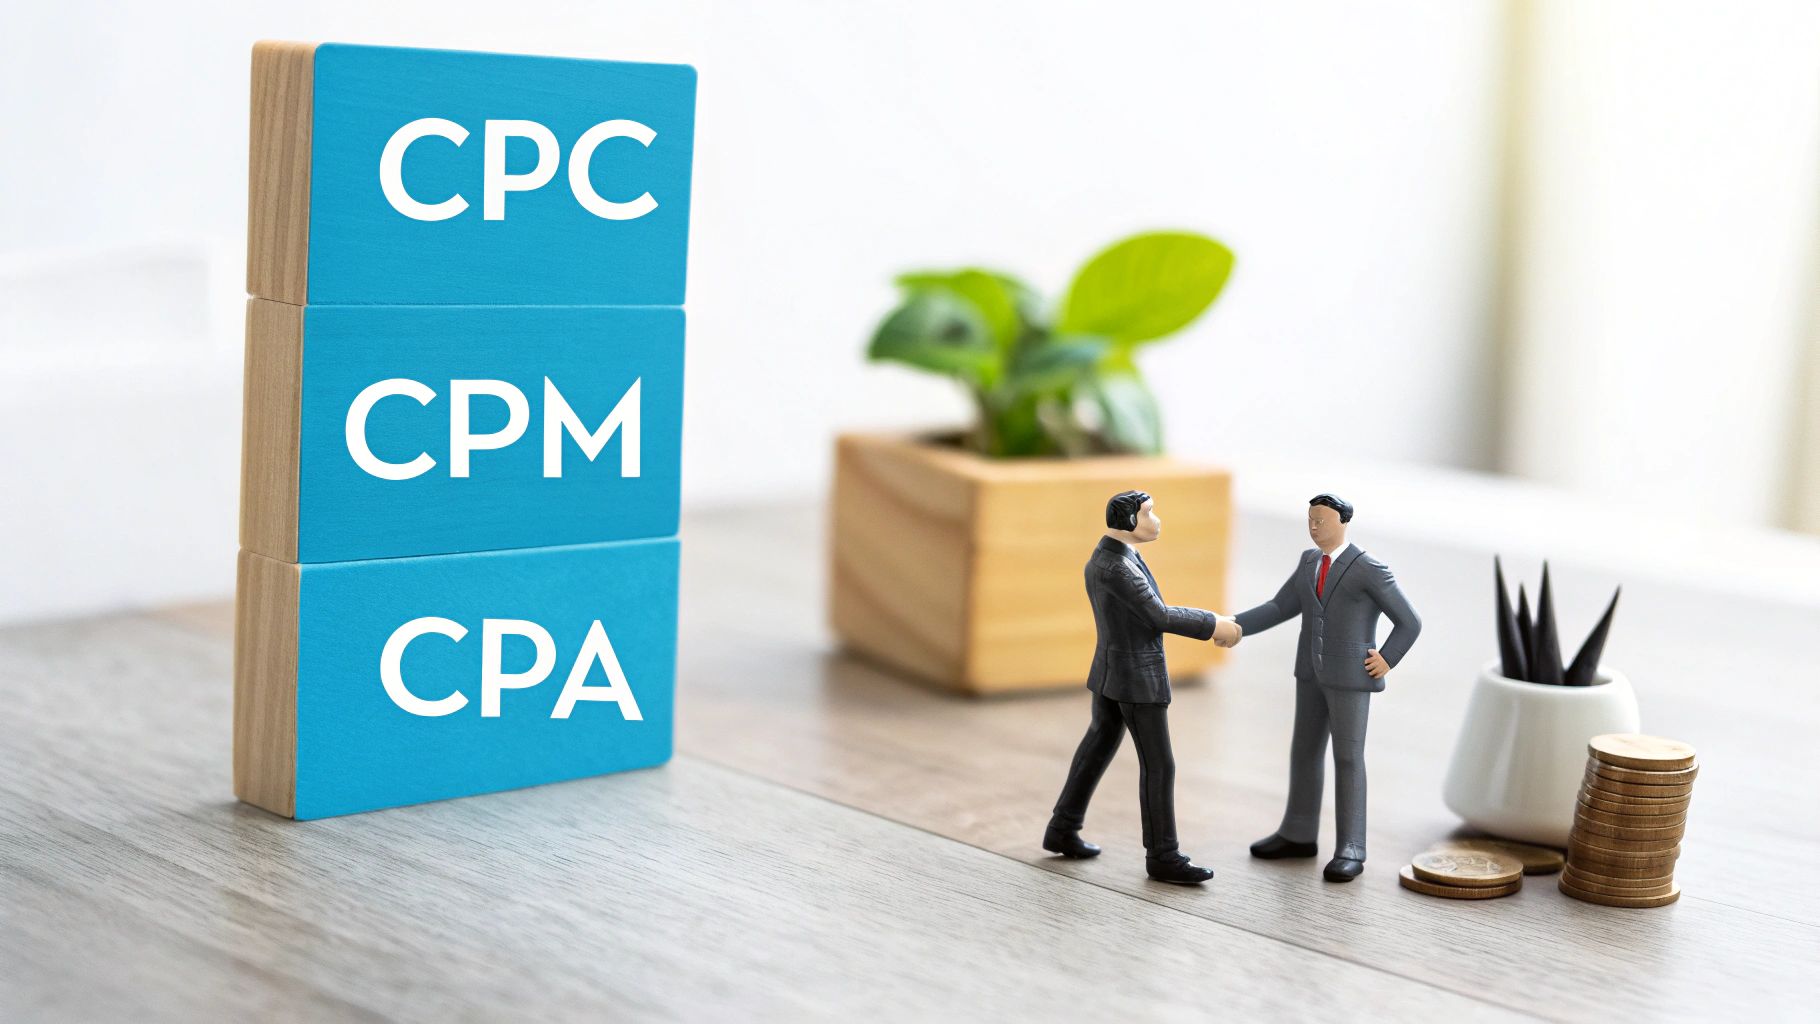
Before you set a budget or tweak your ads, you need to get familiar with the three core PPC cost models. I’ve seen campaigns stumble when these basics aren’t clear—so let’s break them down.
Defining CPC, CPM And CPA
- CPC (Cost Per Click) is like paying for a ticket—you only shell out when someone actually clicks your ad.
- CPM (Cost Per Thousand Impressions) resembles renting a billboard; you cover every 1,000 eyeballs that pass by.
- CPA (Cost Per Acquisition) means you pay only when a desired action happens, much like paying once someone signs up.
“When you see how each model works, you understand exactly what you’re paying for—and why.”
Quality Score Factors
Quality Score plays a starring role in your CPC. When your score is strong, ad platforms often reward you with lower bids and higher placement.
- Keyword relevance to your ad copy
- Expected click-through rate (CTR)
- Landing page quality and user experience
In practice, a stellar Quality Score can slash your cost per click by around 20%. That frees up budget to expand winning campaigns.
Read also our article on how conversion rate impacts PPC performance for deeper insight: How Conversion Rate Impacts PPC Performance
Global PPC Spending Trends
Advertisers worldwide now pour more than US$350 billion into search campaigns each year. On Google Ads, average CPC rates typically range from US$1.60 to US$5.26, depending on factors like industry and location.
For instance, Canada averages about US$1.58 per click, while the United States sits closer to US$2.64. These numbers illustrate how competitive landscapes and data sources can shift your benchmarks.
Learn more about PPC cost benchmarks on AgencyAnalytics
“With real benchmarks in hand, you can set goals that make sense—and win over stakeholders at the same time.”
Conversion Rate Impact On CPA
Your conversion rate bridges clicks and actual acquisitions, directly steering CPA.
- A 5% conversion rate on 1,000 clicks delivers 50 conversions
- At US$2 per click, total ad spend hits US$2,000
- That works out to a US$40 CPA
By tweaking headlines, forms or calls-to-action on your landing page, you can lift that rate and drive down your acquisition cost.
Case Study Example
A small ecommerce store bumped its conversion rate from 2% to 4%, and its CPA dropped from US$50 to US$25 in just two months. Those clear gains make it easy to tell a compelling ROI story.
Choosing The Right Metric For Your Goal
- Use CPC when your focus is on driving traffic and measuring clicks.
- Choose CPM to boost brand visibility and reach large audiences.
- Opt for CPA when you want to pay only for real conversions and true ROI.
Metric Comparison Table
| Metric | Best For | Key Benefit |
|---|---|---|
| CPC | Traffic | Control cost per visit |
| CPM | Awareness | Max visibility cost-efficiently |
| CPA | Conversions | Pay only for results |
Matching your campaign goal to the right cost model clarifies ROI calculations and strengthens stakeholder conversations.
Key Takeaways
- CPC, CPM, and CPA each align with specific objectives.
- A higher Quality Score reduces CPC, so keep refining those ads and landing pages.
- Even small lifts in conversion rate can dramatically lower your CPA.
With this framework, you can confidently explain the cost of PPC advertising and make data-driven decisions.
Focus on metrics that match your goals for ROI.
Industry Benchmarks For PPC Costs
Benchmarking your PPC spend against industry averages gives you a reality check on bid expectations. It’s the quickest way to see if your campaigns are paying off or draining your budget.
PPC costs can swing dramatically depending on the sector you’re in. Legal and insurance advertisers often face US$9 per click, while travel and arts & entertainment stay under US$2. Finance and insurance verticals typically report CPCs between $3.50 and $6.75, with cost-per-lead numbers climbing above $70 in cutthroat markets. On the flip side, real estate and entertainment campaigns average around $1.55 to $1.60, underscoring how intent and competition shape your per-click price. For more deep-dive data, check out the WebFX report on PPC statistics.
Industry CPC Benchmarks
Below is a snapshot of average cost-per-click across key industries. This table highlights where you might need to flex your budget or where you can capture more clicks for less.
| Industry | Average CPC |
|---|---|
| Legal & Insurance | $9.00 |
| Finance & Insurance | $5.13 |
| Travel & Entertainment | $1.90 |
| Real Estate & Entertainment | $1.60 |
Notice the wide gap between high-cost and budget-friendly verticals. In practice, this means:
- In competitive fields like legal, tight budget controls and bid caps keep costs from spiraling.
- Sectors such as travel allow you to drive higher click volume for the same spend.
- Aligning your own CPCs with these benchmarks shows whether you’re overbidding or underinvesting.
Key Takeaways On Benchmarks
Understanding these industry averages helps you build realistic budgets and negotiate smarter. For tactics on tightening bids and boosting ad relevance, visit our guide on Google Ads best practices.
“Industry benchmarks give you a reality check on your PPC spend and guide strategic bid adjustments.”
Extending Benchmarks To CPM And CPA
Beyond CPC, it’s crucial to track CPM (cost per thousand impressions) and CPA (cost per acquisition). These figures will steer whether you chase broad awareness or focus on conversions.
| Metric | Affordable Benchmark | Expensive Benchmark |
|---|---|---|
| CPM | $3.00 (Real Estate) | $12.00 (Insurance) |
| CPA | $30 (Travel) | $70 (Insurance) |
High-competition sectors push both CPM and CPA skyward. To keep your campaigns tuned:
- Identify your primary goal — use CPM for reach or CPA for direct actions.
- Adjust bids and audience targeting to optimize the chosen metric.
- Revisit benchmarks regularly, since seasonality can shift costs significantly.
Campaign Benchmark Case Study
A local home services business noticed its average CPC was $6.25, far above the $1.60 real estate benchmark. By drilling into city-specific keywords and excluding underperforming areas, they trimmed CPC to $3.40 in just two weeks.
Meanwhile, an e-commerce retailer in the travel space set a $30 CPA target. Monitoring the $30 benchmark and moving ads to non-peak hours dropped their CPA to $25, boosting profitability.
- The home service team refined geo-targeting to sideline low-value zones.
- The travel retailer optimized ad schedules to capitalize on off-peak rates.
These real-world examples show how applying benchmarks guides smart, data-driven tweaks that improve campaign performance.
Factors That Influence PPC Costs
When you tweak your ad position or schedule campaigns for specific hours, you’re directly affecting your spend. These variables overlap in ways that can ease or inflate your CPC, CPM, and CPA.
By zeroing in on what really moves the needle—like match type or bid adjustments—you swap guesswork for data-driven decisions. With that insight, you stay ahead of the auction.
Competition Levels
If a dozen advertisers are chasing the same keywords, expect your CPC to climb. It’s simple supply and demand in action.
On the flip side, a local niche can snag clicks for far less. For example, a legal firm in a crowded market might pay $8.50 per click, whereas a small-town repair shop averages under $0.75.
- High-volume terms in finance, insurance, or legal often demand $6+ per click.
- Narrow or geographic queries can cost under $1.
- Premium ad slots may require minimum bid thresholds.
“When we trimmed head keywords in a national campaign, our average CPC dropped 30% in one week.”
More bidders don’t just hike clicks—they drive up CPM and CPA too.
Keyword Match Types And Quality Score
Your choice of match type shapes reach and costs. Broad match casts a wide net; exact match hones in on precise searches.
Quality Score measures relevance, click rates, and landing page fit. Ads hitting a score of 7+ often see CPCs fall by 15% or more.
- Broad match captures related phrases but can spike CPCs.
- Phrase match balances reach and relevance for managed costs.
- Exact match locks in on exact queries, trading volume for precision.
Aligning ad copy and headlines with your landing page is a quick way to boost Quality Score—and trim spend.
Seasonality And Device Targeting
Peak shopping seasons can trigger price surges as automated bids chase volume. Planning ahead saves you from overspending during spikes.
Device type matters too: mobile clicks often carry a premium, while desktop clicks can be cheaper after hours.
- Use bid modifiers by daypart to tap lower-cost windows.
- Track mobile versus desktop CPC trends in your analytics.
- Create device-specific ad copy and offers to lift conversions.
A travel retailer saw mobile CPCs jump 40% in summer. Shifting budget to desktop nights recaptured efficiency.
Capping bids during flash sales or holidays puts a hard stop on runaway costs.
Location Targeting
Geographic bid adjustments can slash wasted spend. Focusing on high-value zones yields quick savings.
For example, a Tampa salon cut CPC by 25% by excluding distant ZIP codes and zeroing in on nearby neighborhoods.
- Layer geographic segments with audience insights for sharper reach.
- Compare CPCs across regions in campaign reports.
- Update location bids monthly based on performance data.
A Tampa fitness studio tweaked city bids and saw CPA drop 20% in two weeks. They reallocated budget to the neighborhoods with the most bookings.
When you blend tight match types, off-peak bidding, and geotargeting, your CPC and CPA can shrink by half in a single quarter.
Mastering these levers hands you real control over your PPC spend. Remember, landing page quality feeds into both Quality Score and conversion rates. For actionable tips, check out our guide on best practices for landing page design.
Testing, monitoring, and iterating every day will keep your campaigns lean and effective.
How To Calculate PPC Budgets And Costs
PPC budgeting shouldn’t be guesswork. By leaning on straightforward formulas and real data, you can forecast spend, conversions, and ROI with confidence.
You’ll multiply expected click volume by your average CPC, translate clicks into conversions to estimate CPA, then factor in profit margins to hit your growth targets. This step-by-step approach keeps your campaigns on solid ground.
For example, 1,000 clicks at $2.00 per click forecast a $2,000 monthly investment.
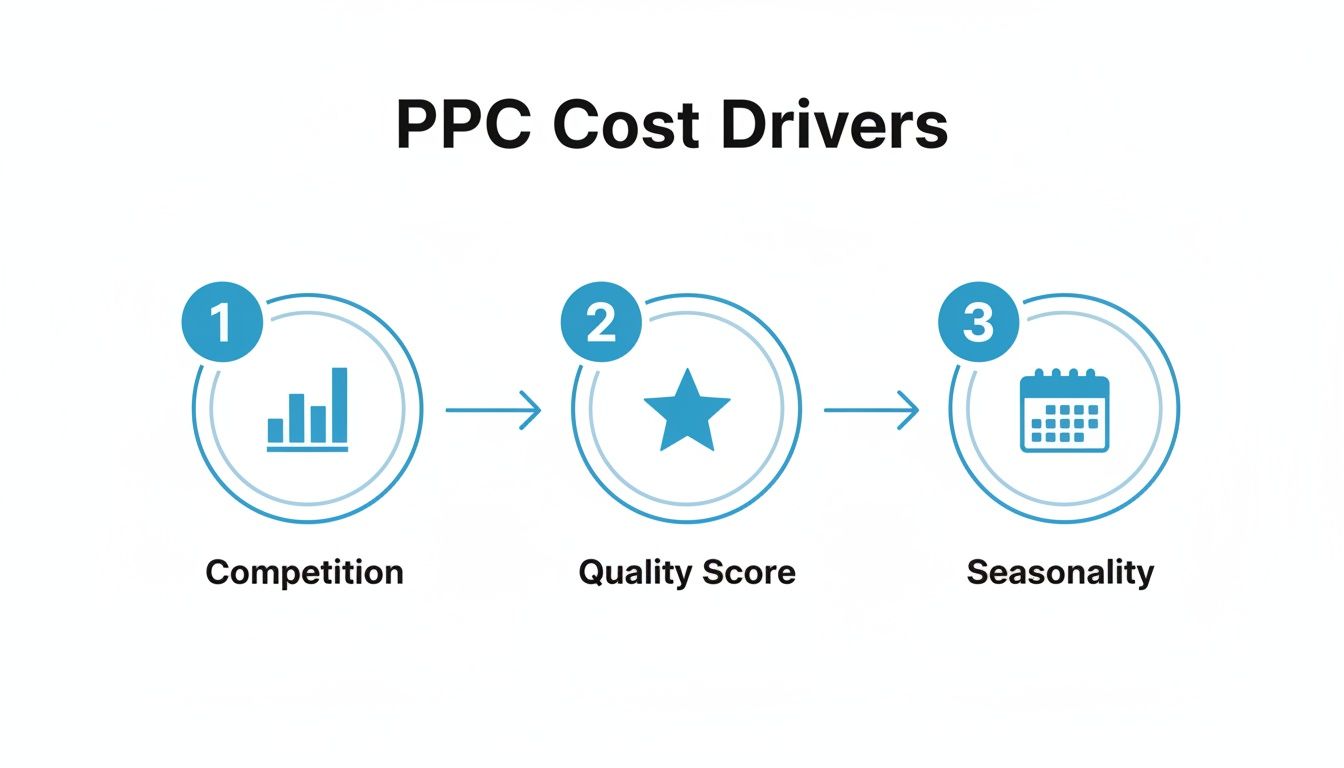
This infographic shows how Competition, Quality Score, and Seasonality flow into your bidding strategy. When competition heats up, bids climb. A strong Quality Score or off-peak timing can pull your CPC down.
Forecast Monthly Spend
Think of this like planning a road trip: clicks are miles, and CPC is the fuel price. You wouldn’t set off without checking gas costs—and your campaign deserves the same care.
- Estimate average monthly searches for your keywords.
- Calculate a realistic click-through rate (CTR).
- Multiply your projected clicks by your average CPC.
Keep refining these numbers each month based on real performance.
“Understanding your baseline click volume is half the budgeting battle.”
Project Conversions And CPA
Clicks drive traffic, but conversions pay the bills. Use past performance or industry benchmarks to predict your acquisition cost.
- Forecast conversions: Clicks × Conversion Rate.
- Calculate CPA: Total Spend ÷ Expected Conversions.
- Run scenarios with different conversion rates to see CPA shifts.
- Compare your CPA against your revenue per acquisition target.
Now every click carries a clear dollar value toward your profit goals.
Factor In Profit Margins For ROI
Running ads without profit targets risks breaking even—or worse, losing money. Define a margin first, then let it guide your bidding.
- Choose a profit margin, for example 20%.
- Adjust CPA target: CPA ÷ (1 – Margin).
- Tight margins? Pull back bids on low-value keywords.
- Healthy margins? Scale up on your top performers.
Ignoring this step often leads to flat campaigns that stall growth.
Learn how to grow long-term revenue in our guide on increasing customer lifetime value
Case Study: E-Commerce Store
An online retailer planned for 500 clicks at $1.50 CPC, totaling $750.
With a 4% conversion rate, they expected 20 orders.
- CPA = $750 ÷ 20 = $37.50
- With a 25% margin, they could spend up to $50 per acquisition.
They kept costs below target and reinvested the savings into testing new ad variations.
Case Study: Local Service Provider
A local landscaper budgeted for 200 clicks at $3.00 CPC, so their spend was $600.
At a 10% conversion rate, that yielded 20 leads.
- CPA = $600 ÷ 20 = $30
- With a 30% margin, their target CPA was $42.86
They focused on high-value zip codes and tweaked ad copy to lift click-through rates.
Customizable Budget Worksheet
Copy this template into Google Sheets or Excel to plug in your own figures:
- Clicks: Your projected monthly clicks.
- CPC: Average cost per click on your chosen platform.
- Conversion Rate: Historic or benchmark percentage.
- Profit Margin: The margin you need to hit.
The sheet auto-calculates spend, CPA, and ROI. Tweak any input to see how one metric shift ripples through your budget.
Next Steps For Budget Tuning
Once you have budget and CPA targets, real data takes over.
- Check spend and conversions each week to spot trends.
- Adjust bids up or down based on performance pacing.
- Pause keywords with CPAs above target and boost those below.
- Experiment with ad extensions, landing page tweaks, and new match types.
Regular monitoring can cut wasted spend by up to 30% over time.
Use this process to keep your PPC budget lean, mean, and focused on growth.
Strategies To Reduce PPC Costs
Lowering your PPC spend without losing momentum takes a series of small, smart adjustments. These tactics are designed to trim your CPC and CPA while keeping clicks steady.
First, sharpen your negative keyword list so you’re not paying for irrelevant searches. Then, refresh your ad copy to mirror what people are actually typing. Finally, organize keywords and ads into tight groups for more precise bidding.
- Refine Negative Keyword Lists by excluding searches that drain budget without delivering value.
- Group Keywords into focused themes to streamline bidding and boost relevance.
- Update Ad Copy every two weeks to test different calls to action, special offers, and unique angles.
A retail client cut their average CPC by 22% just by pruning out unrelated search terms.
Negative Keyword Refinement
Think of negative keyword refinement like editing a playlist: you remove the tracks that throw off the vibe. By filtering out off-topic searches, your ads only surface for truly interested shoppers.
Grouping related negatives also stops your bids from overlapping and driving up costs.
“We paused around 15% of our keywords and saw a 30% drop in CPC in just one month,” says one campaign manager.
Once your keyword list is streamlined, turn your attention to landing page tests. Swapping a headline or tweaking a button can lift conversions by up to 20%.
- Run A/B tests on landing pages to identify the layout that converts best.
- Leverage session recordings and heatmaps to spot confusing elements.
Long-tail keywords often come at a 40% discount and attract visitors who are closer to buying. You can also use day-parting to bid more aggressively during off-peak hours and save on clicks.
Advanced Bidding Adjustments
Fine-tuning your bids with modifiers for location, device, or audience segment can deliver big savings. For example, boosting your bid by 15% in high-performing regions and dialing it back elsewhere can lower your CPA by double digits.
| Adjustment Type | Example Change | Expected Impact |
|---|---|---|
| Geographic Modifier | +15% in Top Regions | 10–20% Lower CPA |
| Device Bid Modifier | -10% on Mobile | 5–10% CPC Drop |
A local fitness studio slashed its CPA by 28% after applying device bid adjustments.
Automation And Retargeting
Automation rules help you pause low-performers and raise bids when conversions are a bargain. Layer in audience retargeting to re-engage browsers with tailored offers at lower CPC.
- Set rules to pause ads with CTR below your threshold.
- Increase bids automatically when CPA falls beneath your target.
- Retarget users who visit key pages but don’t convert.
Check out our guide on PPC management for small business to optimize these rules and strategies.
Automating routine tasks can cut wasted spend by 25% and free up hours each week. When you combine this with manual optimizations, you’ll see your PPC costs drop—and your ROI climb.
Partnering with an agency like Netco Design brings experienced eyes to your campaigns. Their team manages tests, bid strategies, and performance insights so you can concentrate on scaling.
“Smart cost reduction is an ongoing process, not a one-off fix,” notes a PPC specialist.
Keep refining—and keep those savings rolling in.
FAQ
How Can I Predict Average CPC Before Launching A PPC Campaign?
Forecasting your CPC is a bit like checking the weather before a road trip—you want to know what you’re up against. Start by pulling suggested bids in Google’s Keyword Planner and layer in real-world benchmarks from your industry.
- Pull average bids from the Keyword Planner tool
- Compare your findings against industry ranges like $1.60–$5.26
- Run a small pilot campaign to see actual CPCs in your niche
Running that mini test budget is the final proof—you’ll spot any surprises before you commit your full spend.
What Factors Most Affect Cost Per Acquisition?
Imagine your CPA as the final puzzle piece in a campaign. Several moving parts shift that cost:
- Conversion Rate
- Ad Relevance
- Quality Score
- Seasonality
Tweak any one of these and your CPA can swing by 20–30% overnight.
Alternative Platforms
If Google Ads feels like a crowded highway, it might be time to explore side streets. Bing, LinkedIn, or TikTok often have lower entry costs and fresh audiences ready to convert.
| Platform | Typical CPC Range |
|---|---|
| Google Ads | $1–$5 |
| Microsoft Ads | $0.70–$4 |
| LinkedIn Ads | $5–$8 |
“Diversifying platforms can cut overall cost of PPC advertising by reaching new audiences.”
By testing one new channel at a time, you’ll discover where your message resonates without blowing your budget.
Agency Management
Deciding whether to go it alone or bring in an agency often comes down to bandwidth and expertise. If bid management, A/B testing, and in-depth reporting are eating your hours, an agency can step in.
- They craft strategy and handle daily optimizations
- They set up robust tracking and deliver clear reports
- You stay focused on scaling your business
Review your internal cost vs. the value of time saved. Sometimes handing off the heavy lifting leads to faster growth.
Ready to cut PPC costs and boost ROI? Partner with Netco Design LLC for expert PPC management.

