

table of contents
Calculating marketing ROI is simpler than you might think. The basic formula is: (Revenue from Marketing – Marketing Cost) / Marketing Cost. The result gives you a straightforward percentage that connects your team’s spending directly to the company’s bottom line.
Why Marketing ROI Is Your Most Important Metric

Before you even think about opening a spreadsheet, let’s get one thing straight: marketing return on investment (ROI) is more than just a number. It’s the ultimate proof that links your team’s hard work to the company’s financial health. If you want to prove your value, secure bigger budgets, and make smarter decisions, tracking ROI isn’t optional.
Let’s be honest, vanity metrics like social media likes and website traffic can be misleading. They show activity, sure, but they don’t prove profitability. A solid grasp of ROI, on the other hand, lets you speak the language of the C-suite—revenue, profit, and growth.
Justifying Your Marketing Budget
In too many companies, marketing is seen as a cost center until proven otherwise. When you can walk into a meeting and show that every dollar spent brings back multiple dollars in return, the entire conversation changes. You’re no longer just asking for money; you’re presenting a clear investment opportunity.
Think about the difference. Instead of saying, “We got 100K impressions and 5K clicks,” you can confidently state, “We spent $20,000 and generated $80,000 in revenue—a 300% ROI.” This shifts the narrative from activity to tangible outcomes.
This data-driven approach is your best friend during budget season. It not only helps you defend your current spending but gives you the ammunition to make a compelling case for scaling up the campaigns that are actually working.
Driving Smarter Strategic Decisions
Knowing your ROI helps you pinpoint which channels and campaigns are pulling their weight—and which are just draining your budget. With countless tactics to choose from, this kind of clarity is priceless.
It forces you to answer the tough, strategic questions:
- Which ad channels deliver the best returns? Is it time to double down on Google Ads, or should you be shifting more of that budget to social media?
- What kind of content actually resonates with high-value customers? Are blog posts outperforming webinars, or is it the other way around?
- Are your brand awareness efforts paying off down the line? How do those top-of-funnel activities eventually influence sales?
By analyzing ROI, you stop guessing and start making decisions based on cold, hard data. Some strategies can yield incredible results; it’s worth it to discover how strategies like retargeting can deliver high marketing ROI. This ruthless focus on profitability ensures your efforts are always tied to core business goals, like figuring out how to increase customer lifetime value.
Alright, let’s get down to the brass tacks. We’ve talked about why ROI matters, but now it’s time to roll up our sleeves and actually calculate it.
Don’t worry, you don’t need a math degree. Calculating marketing ROI boils down to a couple of core formulas that every marketer should have in their back pocket. These are the equations that connect the dollars you spend to the dollars you bring in.
At its simplest, it’s all about what you got back versus what you put in. We’ll start with the quick-and-dirty formula that’s great for a fast read on performance, then move to a more nuanced one that gives you a much truer picture of profitability.
The Foundational Simple ROI Formula
The first stop for most marketers is the Simple ROI formula. It’s clean, straightforward, and perfect for getting a direct measurement of the total revenue generated from a campaign against what it cost you. This is my go-to for campaigns with crystal-clear sales outcomes.
The basic idea is to subtract your marketing costs from the sales your campaign generated, then divide that number by your costs. Multiply by 100, and you’ve got your ROI percentage.
For example, say you run a digital ad campaign that costs $20,000 and brings in $100,000 in new sales. The math would be (($100,000 – $20,000) / $20,000) × 100, which equals a 400% ROI. It’s a popular formula because it’s so direct—perfect for things like Google Ads or email campaigns where you can easily trace a sale back to the source.
Here’s the formula in its classic form:
(Revenue from Marketing Campaign – Marketing Investment) / Marketing Investment x 100 = ROI %
Let’s see it in action.
E-commerce Example: A Social Media Ad Campaign
An e-commerce brand spends $5,000 on a targeted Instagram ad campaign for a new product line. Using UTM codes and platform analytics, they track $25,000 in sales directly from those ads.Let’s plug it in:
- ($25,000 Revenue – $5,000 Cost) / $5,000 Cost = 4
- 4 x 100 = 400% ROI
What does this mean? For every $1 they put into that campaign, they got $5 back in revenue. Not bad at all.
This simple formula is fantastic for its clarity. But it has a huge blind spot: it ignores the cost of the products you sold. A huge revenue number looks great, but it doesn’t automatically equal huge profits. That brings us to a much more insightful way to calculate ROI.
A Deeper Dive with the Gross Profit ROI Formula
If you’re selling physical products or any service with direct costs tied to it, the Gross Profit ROI formula is where you get the real story. Instead of looking at total revenue, this formula uses your gross profit—the money left after you subtract the Cost of Goods Sold (COGS).
This is a critical distinction. It strips away the cost of producing or delivering what you sold, showing you the actual profit your marketing spend generated.
The formula looks like this:
(Gross Profit from Campaign – Marketing Investment) / Marketing Investment x 100 = ROI %
And remember, Gross Profit = Revenue – Cost of Goods Sold (COGS).
Let’s look at our e-commerce example again, but this time with a focus on profit.
E-commerce Example Revisited
The campaign still generated $25,000 in revenue from a $5,000 ad spend. But now, let’s factor in that the COGS for those products was $15,000.First, find the Gross Profit:
- $25,000 Revenue – $15,000 COGS = $10,000 Gross Profit
Now, let’s calculate the ROI with this new number:
- ($10,000 Gross Profit – $5,000 Cost) / $5,000 Cost = 1
- 1 x 100 = 100% ROI
See the difference? The ROI plummeted from a flashy 400% to a more sober 100%. It’s still a positive return, but it’s a much more realistic view of the campaign’s success. It tells us that for every $1 invested, the company made $1 in actual profit after covering all its direct costs.
To truly master these formulas, it helps to see how modern tools are used for measuring ROI and key performance indicators.
Comparing Simple ROI vs Gross Profit ROI
To make it even clearer, here’s a side-by-side look at the two formulas. Each has its place, and knowing when to use which is key to making smart marketing decisions.
Simple ROI Formula
- Primary Goal: Measures revenue generation efficiency.
- Key Input: Total Revenue from Campaign
- Best For: Quick assessments, lead gen campaigns, or businesses with very low COGS.
- Potential Blind Spot: Can inflate perceived success by ignoring product costs.
Gross Profit ROI Formula
- Primary Goal: Measures actual profitability.
- Key Input: Gross Profit (Revenue – COGS)
- Best For: E-commerce, physical products, and making budget allocation decisions.
- Potential Blind Spot: Requires accurate COGS data, which can sometimes be tricky to allocate.
Ultimately, choosing the right formula comes down to what you’re trying to figure out. Simple ROI is great for a quick pulse check on whether a campaign is driving sales. But for serious budget planning and understanding true financial impact, Gross Profit ROI is the only way to go.
Of course, none of this revenue happens if you can’t turn visitors into buyers. If you need a refresher, check out our guide on what is conversion rate in marketing.
How to Gather the Right Data for Accurate Calculations
Your marketing ROI calculation is only as reliable as the data you feed it. Let’s be honest: a precise result depends on getting a complete picture of both your costs and your revenue, and finding every piece of that puzzle can be a real headache. Garbage in, garbage out—it’s a simple truth that will make or break your efforts.
To build a calculation you can confidently stand behind, you need a clear game plan for tracking every crucial input. This means going beyond the obvious expenses and setting up your revenue tracking to reflect how customers actually find you.
This flow chart breaks down the basic process of turning raw numbers into a clear ROI percentage.
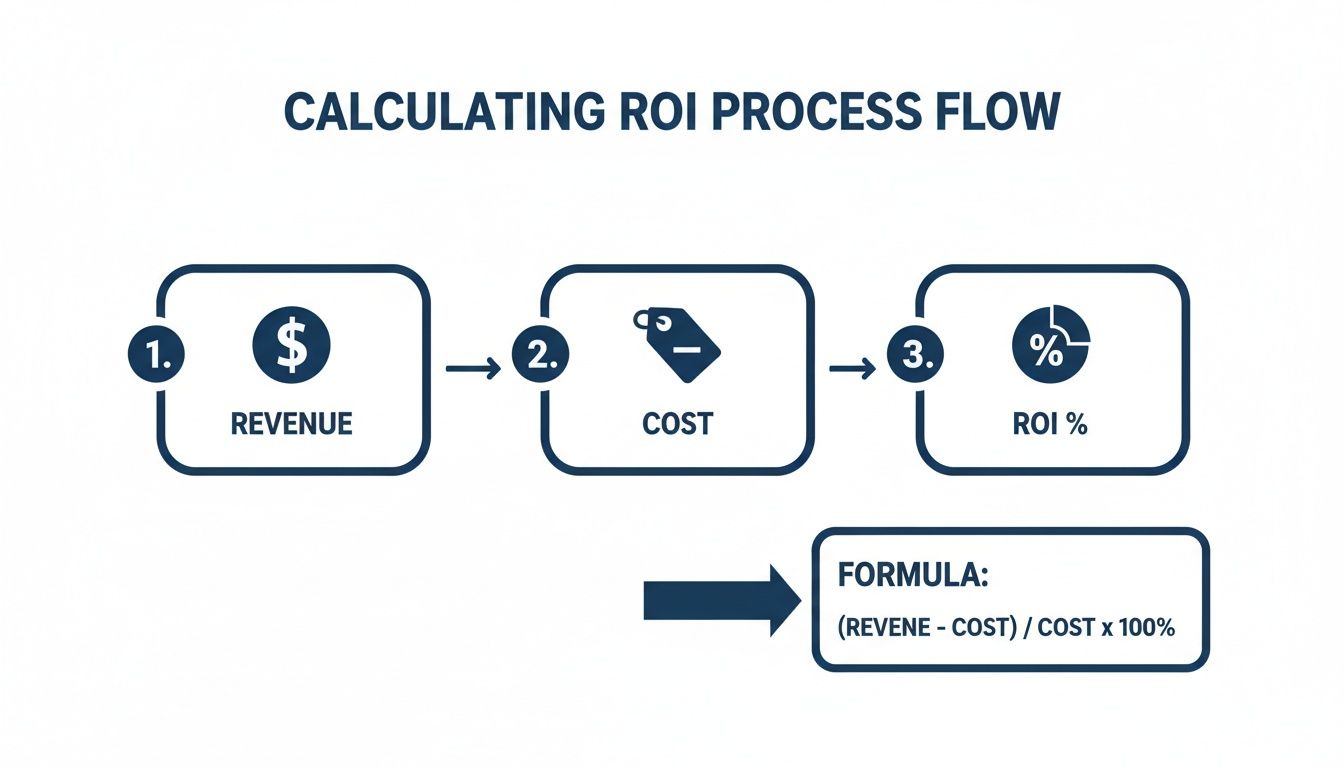
Ultimately, it highlights a simple path: identify revenue, subtract all the costs, and you’re left with a clear performance metric. Easy, right? Well, the devil is in the details.
Uncovering All Your Marketing Costs
The single biggest mistake I see marketers make is undercounting their costs. Ad spend is the easy part, but it’s often just the tip of the iceberg. True accuracy means you have to account for every single dollar that went into making a campaign happen.
Think beyond the obvious. Here are some of the expenses that frequently get missed:
- Creative and Production Costs: Did you hire a freelance designer for your ad creative? Was there a video production team involved? Those invoices are a direct part of your investment.
- Agency or Consultant Fees: If you’re working with a partner for SEO, PPC, or content, their retainers or project fees absolutely must be included in the campaign’s total cost.
- Software and Tools: Don’t forget about your email marketing platform, social media scheduler, or analytics tools. A portion of those subscription costs should be allocated to the campaigns that rely on them.
- Team Salaries: This one’s tricky, but it’s essential. If a team member spent 20 hours on a campaign and their loaded hourly rate is $50, that’s $1,000 in people-costs that needs to be factored in.
By creating a comprehensive list of all direct and indirect expenses, you get a much more realistic view of your total marketing investment.
Setting Up Your Revenue and Lead Tracking
On the other side of the equation is revenue. To attribute sales correctly, your tracking has to be set up properly from the start. This is where your tech stack—your analytics platform, CRM, and e-commerce system—becomes your best friend.
For instance, using UTM parameters consistently on all your campaign links is non-negotiable. These simple tags tell Google Analytics exactly where a visitor came from, allowing you to trace a sale back to a specific social media post, email, or ad. It’s foundational.
Inside your CRM, you can track leads from their first touchpoint all the way to a closed deal. This helps you see which marketing efforts are not just generating leads, but generating valuable leads that actually turn into customers. The data gathered here is invaluable for creating something like an SEO report that needs to show tangible results. To learn more, you can explore our in-depth guide on what is an SEO report and how to build one that truly demonstrates value.
A critical piece of advice: make sure your platforms are integrated. When your website analytics, CRM, and sales platform can talk to each other, you create a seamless data flow that makes attributing revenue much easier and far more accurate.
Choosing the Right Attribution Model
Once your tracking is in place, you have to decide how to give credit for a sale. A customer might see a Facebook ad, click a Google search result, and then open an email before finally buying. So, which channel gets the credit? This is where attribution models come in.
Choosing the right model isn’t about finding a single “correct” answer. It’s about finding the one that best reflects your typical customer journey.
- First-Touch Attribution: This model gives 100% of the credit to the very first interaction a customer had with your brand. It’s great for understanding which channels are best at generating initial awareness.
- Last-Touch Attribution: Here, the final touchpoint before the sale gets all the credit. It’s simple and really useful for identifying which channels are most effective at closing deals.
- Multi-Touch Attribution (e.g., Linear): This approach spreads the credit evenly across every touchpoint. It acknowledges that multiple interactions contributed to the final sale, giving you a more balanced view of your channel performance.
For most businesses with a sales cycle longer than a few days, a multi-touch model gives you a more holistic and accurate picture. It helps you avoid overvaluing your closing channels while undervaluing the crucial awareness-building activities that got the conversation started in the first place.
Real-World Examples of ROI in Action

Theory is great, but seeing the numbers play out is where it all clicks. Let’s walk through a couple of real-world examples that show exactly how to calculate marketing ROI in different situations.
First, we’ll look at a straightforward Google Ads campaign where it’s easy to connect the dots between ad clicks and sales. Then, we’ll dive into a more complex, multi-channel launch to see how to piece everything together. These blueprints should give you a solid framework you can adapt for your own campaigns.
Scenario One: A Focused Google Ads Campaign
Imagine a local home services company in Tampa, Florida, running a Google Ads campaign for kitchen remodeling. They need to know if their ad spend is actually making them money. Thankfully, the attribution here is pretty direct: someone clicks an ad, fills out a form on the landing page, and the sales team takes it from there.
Here’s a quick breakdown of their monthly costs:
- Google Ads Spend: $3,000
- PPC Management Fee: $750 (what they pay their agency)
- Landing Page Software: $150
That brings their total marketing investment to $3,900. If you’re wondering how costs like these stack up, our guide on the cost of PPC advertising offers a great overview.
Over the month, the campaign brought in 20 qualified leads. The sales team worked their magic and closed 5 of those leads, with each new project averaging $15,000.
Now for the fun part—the revenue:
- 5 new projects x $15,000 per project = $75,000 in Revenue
Let’s plug these numbers into our simple ROI formula:
ROI % = (($75,000 Revenue – $3,900 Cost) / $3,900 Cost) x 100
The result? An incredible 1,823% ROI. Put another way, for every single dollar they invested, they generated over $19 in revenue. Not bad at all.
Scenario Two: A Multi-Channel E-commerce Launch
Things get a bit more complicated with our second scenario. An e-commerce brand is launching a new line of sustainable activewear. Their campaign spanned three months and involved several different channels, which makes tallying up the costs and attributing the sales a little trickier.
Their total marketing investment was a mix of different expenses:
- Social Media Ads (Meta & TikTok): $15,000
- Email Marketing Platform: $1,200 (pro-rated for the three-month campaign)
- Influencer Collaborations: $5,000
- Content Creation (Photoshoot/Video): $3,500
All in, the total marketing investment for the launch was $24,700.
Using their analytics platform and a multi-touch attribution model, they were able to trace $95,000 in sales directly back to these marketing efforts. A quick calculation shows a 284% ROI, which sounds fantastic on paper.
But here’s the catch. For a business that sells physical products, you can’t ignore the cost of making those products. This is where the Gross Profit ROI formula comes in, as it accounts for the cost of goods sold (COGS) and prevents you from reporting an inflated, misleading number.
In this case, the COGS for the activewear sold was $50,000. To get our gross profit, we just subtract that from the revenue: $95,000 – $50,000 = $45,000.
Let’s re-run the calculation with the Gross Profit ROI formula:
ROI % = (($45,000 Gross Profit – $24,700 Cost) / $24,700 Cost) x 100
This revised calculation gives us a Gross Profit ROI of 82%. It’s not as flashy as the first number, but it’s infinitely more valuable. It tells the company’s leadership that after covering the cost of the products and the marketing to sell them, the campaign generated a true profit of $0.82 for every $1 invested.
This second example really drives home why you have to look at all your costs—not just marketing spend—to get an honest picture of your performance.
Common Marketing ROI Mistakes to Avoid
Calculating marketing ROI sounds straightforward, but there are a few common traps that can completely skew your results. Getting this wrong doesn’t just lead to bad data—it leads to bad decisions. Let’s walk through the most frequent errors I see so you can build a reporting process that gives you real confidence.
The road to an accurate ROI is littered with potential missteps. From overlooking hidden costs to focusing too narrowly on the first sale, these mistakes can totally undermine the credibility of your reports. The good news? They’re all avoidable with a bit of foresight.
Forgetting to Include All Campaign Costs
This is one of the quickest ways to accidentally inflate your ROI. You only count the obvious expenses, like ad spend, and suddenly you’ve got a 300% ROI that looks amazing on paper. But what about the $5,000 you paid a freelance designer or the monthly agency retainer? True marketing investment is always more than just what you pay for media.
To get an honest number, you have to account for every single dollar associated with the campaign.
- Creative Production: This includes all the fees for designers, copywriters, and video editors who brought your campaign to life.
- Agency Fees: If you partner with an agency for PPC, SEO, or social media, their retainer is a direct campaign cost. Don’t forget it.
- Team Salaries: This one gets missed a lot. You need to allocate a portion of your team’s salaries based on the actual time they spent on the project.
- Software Subscriptions: A fraction of the cost for your email platform, CRM, or analytics tools should absolutely be included.
By diligently tracking these “hidden” costs, you move from a vanity metric to a genuine reflection of profitability. It’s the difference between telling a good story and telling the truth.
Choosing the Wrong Attribution Model
Picture this: a customer sees one of your social media ads, reads a blog post a week later, and finally clicks through an email link to buy something. If you’re using a last-touch attribution model, the email gets 100% of the credit. The ad and the blog post, which were critical parts of the journey, get nothing.
This mistake is especially damaging for any business with a longer sales cycle. When you choose a model that doesn’t fit your customer’s real-world journey, you will constantly undervalue your top-of-funnel and mid-funnel marketing efforts. For most businesses, a multi-touch model offers a much more balanced and realistic view of which channels are actually contributing to a sale.
Ignoring Customer Lifetime Value
Focusing solely on the revenue from a customer’s first purchase is a classic case of short-term thinking. A campaign might only show a modest 50% ROI based on those initial sales. But what if it attracts customers who stick around for years? Its true value is exponentially higher.
When you ignore Customer Lifetime Value (CLV), you’re leaving a huge part of the story out.
For example, a campaign that acquires customers with a high CLV is far more valuable than one that brings in a flood of one-time buyers, even if the initial ROI looks lower. Factoring CLV into your calculations helps you recognize which campaigns are building sustainable, long-term growth for the business. This long-term perspective is also a key part of learning how to improve website conversion rates, as you start to focus on attracting the right kind of customer, not just any customer.
Got Questions About Marketing ROI? We’ve Got Answers.
Jumping into marketing ROI calculations always brings up a few questions. From the classic “what’s a good ROI?” to the trickier task of measuring brand awareness, it’s completely normal to have some lingering uncertainties.
Let’s clear up a few of the most common questions we hear from marketers. Think of this as your go-to guide for overcoming those practical hurdles so you can start applying these concepts with confidence.
What Is a Good Marketing ROI Benchmark?
This is the million-dollar question, and the honest-to-goodness answer is: it depends. There’s no single magic number that works for everyone. The right ROI for you will vary wildly depending on your industry, the channel you’re using, and, most importantly, your company’s profit margins. A SaaS business with high margins can thrive on a completely different ROI than a low-margin e-commerce store.
That said, a widely-cited benchmark to aim for is a 5:1 ratio, which works out to a 400% ROI. For every dollar you put into marketing, you get five dollars back in revenue. It’s a solid target.
- Exceptional ROI: Anything pushing a 10:1 ratio (900% ROI) is absolutely crushing it.
- Profitable ROI: For businesses with tighter margins, even a 2:1 ratio (100% ROI) can be profitable and sustainable.
The most important benchmark is your own. Your ROI just needs to be high enough to cover all your marketing costs, the cost of goods sold (COGS), and still leave a healthy profit. Start by benchmarking against your own past performance and work toward your specific profitability goals.
How Do I Measure ROI for Brand Awareness Campaigns?
I get it—calculating a direct ROI for top-of-funnel campaigns like brand awareness feels fuzzy, but it’s not impossible. Since these campaigns rarely lead directly to a sale, you have to get creative and use proxy metrics that signal future value.
Instead of trying to tie every dollar of ad spend directly to revenue, focus on measuring the impact on metrics that lead to revenue down the road. For example, you can track things like:
- A noticeable jump in branded search volume.
- Growth in direct website traffic (people typing your URL right into their browser).
- Higher social media engagement rates on your posts.
- An increase in downloads for your lead magnets.
To put a number on it, you can assign a monetary value to these actions. Let’s say you know from historical data that one out of every 100 new website visitors from a particular channel eventually becomes a customer with an average lifetime value of $500. In that case, you can assign an estimated value of $5 to each new visitor. This approach gives you a way to calculate an estimated ROI for campaigns that don’t have an immediate, direct line to a sale.
How Often Should I Calculate My Marketing ROI?
The right rhythm for calculating ROI really depends on your sales cycle and the type of campaigns you’re running. A one-size-fits-all approach just doesn’t work here. You have to match your reporting cadence to the speed of your business.
For fast-moving, short-term campaigns—think weekly e-commerce promotions or pay-per-click (PPC) ads—it makes perfect sense to calculate your ROI weekly or bi-weekly. This lets you make quick adjustments to optimize performance on the fly.
On the other hand, for longer-term strategies like SEO or content marketing, a monthly or quarterly calculation is much more realistic. These efforts take time to build momentum, and measuring them too frequently can be misleading and frustrating.
As a rule of thumb, you should run a full ROI analysis for all major campaigns and review your overall marketing ROI both quarterly and annually. This rhythm allows you to make smart strategic shifts while also keeping an eye on the long-term impact of your marketing investments.
At Netco Design LLC, we don’t just build websites; we build revenue-focused growth engines. If you’re ready to stop guessing and start making data-driven decisions that boost your bottom line, let’s talk. Our team in St. Petersburg, Florida, is ready to help you elevate your digital presence with strategies that deliver measurable results. Get in touch with us today to see how we can help.

