

table of contents
TL;DR:
- Most successful marketing teams map three leading indicators and two lagging indicators to a key business goal to maintain focus. They start by establishing a baseline in 30 to 60 days with data sources like GA4 and CRM before setting targets. Clear ownership, standardized formulas, and regular reviews ensure KPIs effectively drive decisions and prevent conflicting measurements.
Start by mapping three leading indicators and two lagging indicators to a single business objective. That one discipline separates teams that optimize in real time from teams that discover problems at the end of the quarter.
The five KPIs most teams should track first:
- Website-to-MQL rate — the percentage of site visitors who become marketing-qualified leads
- MQL volume — total qualified leads generated per period
- MQL-to-SQL conversion rate — how many MQLs sales accepts and advances
- Customer acquisition cost (CAC) — total marketing and sales spend divided by new customers acquired
- Marketing-sourced pipeline — the dollar value of open deals where marketing touched the first conversion
Before you lock in any target, run a 30–60 day diagnostic. Pull baseline data from GA4, your CRM, and your ad platforms. Without a real baseline, every target is a guess — and a guess is not a KPI.
Pro Tip: Set a calendar reminder at day 30 to review your baseline data. If the numbers shift significantly in week five, your tracking setup likely has gaps — fix those before finalizing targets.
What digital marketing KPIs are and why they matter for business outcomes
A KPI (key performance indicator) is a quantifiable measure tied directly to a business outcome. That last part is what most teams get wrong. Sessions, impressions, and follower counts are outputs. They tell you what happened. A KPI tells you whether the business is moving toward its goal.
The distinction matters because dashboards full of outputs create the illusion of progress. A campaign that drives 50,000 impressions but zero conversions has not performed. Contrast that with a KPI like “organic conversion rate” — the percentage of organic visitors who complete a goal action. That number connects traffic to revenue and tells you whether SEO is actually working.
Consider a simple mapping: if the business objective is to grow monthly recurring revenue by 20%, the primary KPI is new MRR from marketing-sourced leads. Supporting metrics like organic sessions or email click rates are useful diagnostics, but they are not the KPI. Keeping that hierarchy clear is what makes digital marketing performance metrics worth tracking.
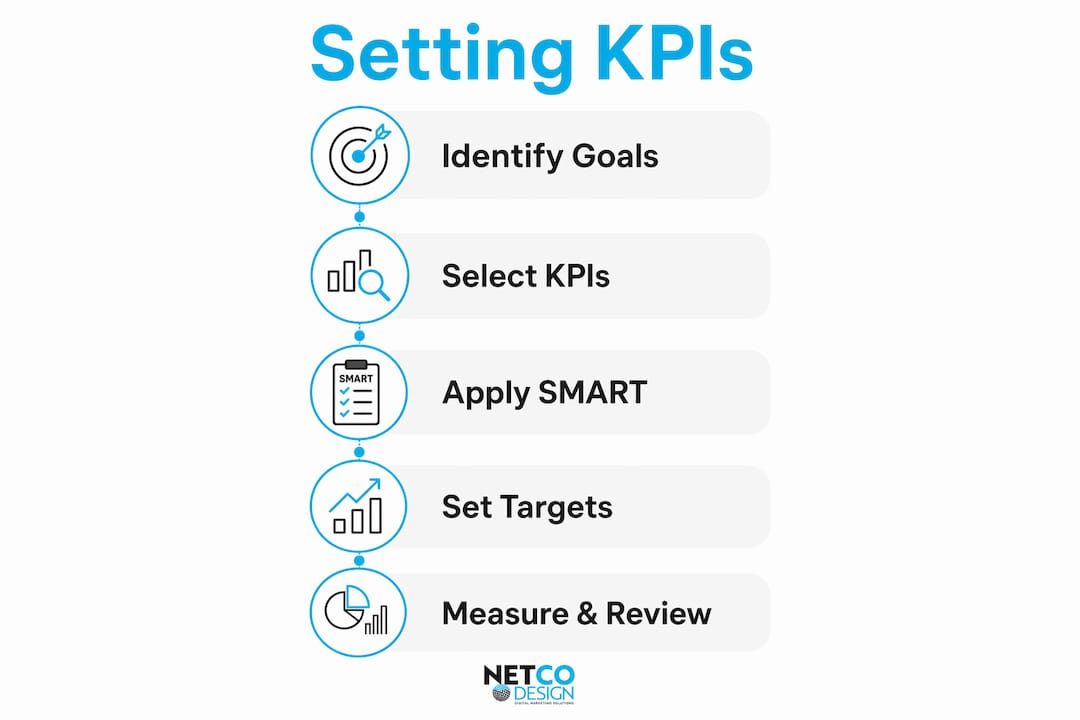
How to translate a business objective into measurable KPIs
Every KPI starts with a business objective, not a channel tactic. Work backward from what the business needs to achieve, then identify the single number that most directly reflects progress toward it.
Step-by-step process:
- State the business outcome clearly. Write it in one sentence: “Grow marketing-sourced pipeline by 40% in Q3.” Vague objectives produce vague KPIs.
- Choose one primary KPI. Pick the metric that moves most directly when the objective is achieved. For pipeline growth, that is marketing-sourced pipeline value.
- Identify two or three leading indicators. These are upstream metrics that predict whether the primary KPI will hit. For pipeline, leading indicators include MQL volume and website-to-MQL rate.
- Add one or two lagging indicators. These confirm the outcome after the fact. CAC and marketing-sourced pipeline percentage are both lagging. They validate that the leads you generated were worth the spend.
- Agree on definitions and formulas. Write down exactly how each KPI is calculated. “MQL” means different things to different teams — define it once, document it, and get sign-off from both marketing and sales.
- Assign ownership. One person owns each KPI. Not a team, not a department — one person who is accountable for the number and responsible for escalating when it drifts.
- Set a reporting cadence. Active campaign KPIs need weekly snapshots. Strategic KPIs like CAC and LTV:CAC are better reviewed monthly or quarterly.
Two quick objective-to-KPI mappings:
- B2B lead generation: Primary KPI = MQL volume. Leading indicators = website-to-MQL rate, content download rate. Lagging indicators = CAC, marketing-sourced pipeline percentage.
- Ecommerce revenue growth: Primary KPI = conversion rate. Leading indicators = add-to-cart rate, email click-to-conversion rate. Lagging indicators = average order value (AOV), ROAS.
How to make every KPI SMART
Every KPI must be SMART: Specific, Measurable, Achievable, Relevant, and Time-bound. A vague KPI like “improve lead quality” cannot be tracked, owned, or acted on. A SMART version looks like this: “Increase MQL-to-SQL conversion rate from 22% to 30% by September 30, measured in HubSpot using the agreed MQL definition.”
Use this naming checklist for every KPI you document:
- Channel or source (e.g., Paid Search, Organic, Email)
- KPI name and unit (e.g., CPA in USD, conversion rate in %)
- Reporting period (e.g., monthly, Q3)
- Attribution model (e.g., last-click, data-driven)
- Data source (e.g., GA4, HubSpot, Google Ads)
Sample formulas to standardize across your team:
- CAC = (Total marketing spend + Total sales spend) / New customers acquired in the same period
- Conversion rate = (Conversions / Total sessions) × 100
- ROAS = Revenue attributed to ads / Ad spend
- MQL-to-SQL rate = (SQLs / MQLs) × 100
Pro Tip: Add the attribution model and data source directly to the KPI name in your dashboard — for example, “Paid Search CPA (Last-Click, GA4, Q3)” — so there is no ambiguity when multiple stakeholders pull the same report.
Standardizing formulas across teams is not a bureaucratic exercise. When marketing calculates CAC one way and finance calculates it another, you get two different numbers for the same metric and no one trusts either. Shared formula documentation resolves that before it becomes a political problem.

Which KPIs should you track by funnel stage and channel?
The right KPI depends on where a prospect is in the funnel and which channel you are measuring. Tracking ROAS at the awareness stage makes no sense. Tracking reach at the bottom of the funnel is equally misleading.
Funnel stage mapping:
- Top of funnel (awareness): Organic sessions, branded search impression share, social reach, video view rate
- Middle of funnel (consideration): Website-to-MQL rate, content engagement rate, email open-to-click rate, lead magnet conversion rate
- Bottom of funnel (decision): MQL-to-SQL rate, CPA, ROAS, pipeline velocity
Channel-specific KPIs:
- SEO: Organic sessions, organic conversion rate, assisted conversions (GA4 attribution)
- PPC: CTR, CPC, CPA, ROAS, impression share
- Email: Open rate, click-to-conversion rate, reactivation lift (for win-back campaigns)
- Social: Reach (awareness phase), engagement rate (consideration), conversion rate (retargeting)
- Ecommerce: AOV, cart abandonment rate, conversion rate, ROAS
B2B vs. B2C: For B2B, account-level KPIs like MQL volume, pipeline contribution, and LTV:CAC ratio matter far more than raw traffic. Deal cycles are long, and a spike in sessions means nothing if none of those visitors match your ICP. For B2C ecommerce, volume metrics like sessions and reach are more acceptable because the path from visit to purchase is shorter and higher-frequency.
Top digital marketing KPIs: definitions, formulas, and when to use each
These are the core KPIs most marketing teams need to know. For each one, the formula, the primary use case, and where to measure it are listed below.
Conversion rate
- Formula: (Conversions / Sessions) × 100
- Use: Primary KPI for any campaign with a direct response goal
- Measure in: GA4, ad platform
Customer acquisition cost (CAC)
- Formula: (Marketing spend + Sales spend) / New customers
- Use: Primary lagging KPI for budget efficiency
- Measure in: CRM + finance data
Customer lifetime value (CLV/LTV)
- Formula: Average order value × Purchase frequency × Customer lifespan
- Use: Strategic KPI for retention and pricing decisions
- Measure in: CRM, ecommerce backend
LTV:CAC ratio
- Formula: CLV / CAC
- Use: Health check on growth sustainability; a ratio above 3:1 is generally considered healthy for SaaS and subscription businesses
- Measure in: CRM + finance
ROAS
- Formula: Ad-attributed revenue / Ad spend
- Use: Primary KPI for paid media efficiency
- Measure in: Google Ads, Meta Ads Manager, GA4
Marketing-sourced pipeline
- Formula: Sum of open deal values where marketing was the first-touch source
- Use: Primary B2B lagging KPI connecting marketing to revenue
- Measure in: CRM (HubSpot, Salesforce)
MQL volume
- Formula: Count of leads meeting the agreed MQL definition per period
- Use: Primary B2B leading KPI
- Measure in: CRM
MQL-to-SQL conversion rate
- Formula: (SQLs / MQLs) × 100
- Use: Diagnostic KPI for lead quality and sales alignment
- Measure in: CRM
Pipeline velocity
- Formula: (Number of opportunities × Win rate × Average deal size) / Sales cycle length in days
- Use: B2B strategic KPI for forecasting
- Measure in: CRM
Average order value (AOV)
- Formula: Total revenue / Number of orders
- Use: Ecommerce efficiency KPI; tracks upsell and bundle effectiveness
- Measure in: Ecommerce backend, GA4
CTR (click-through rate)
- Formula: (Clicks / Impressions) × 100
- Use: Supporting KPI for ad creative and email subject line performance
- Measure in: Ad platform, email platform
Impression share
- Formula: Impressions received / Total eligible impressions
- Use: Competitive visibility KPI for PPC
- Measure in: Google Ads
Bounce rate / engagement rate
- Formula (GA4): Engaged sessions / Total sessions (GA4 uses engagement rate, not bounce rate)
- Use: Diagnostic KPI for landing page and content relevance
- Measure in: GA4
Assisted conversions
- Formula: Count of conversions where the channel appeared in the path but was not the final click
- Use: Supporting KPI to justify upper-funnel spend
- Measure in: GA4 attribution reports
Formulas for CAC and MQL-to-SQL must be standardized across marketing, sales, and finance before you publish your first report. When each team calculates them differently, you spend meetings arguing about numbers instead of acting on them.
How to set numeric targets and use benchmarks
Targets without baselines are aspirations. The process below turns aspirations into trackable commitments.
Step 1: Pull your baseline. Run 90 days of historical data from GA4 and your CRM. Calculate your current conversion rate, CAC, and primary channel KPIs. That is your starting point.

Step 2: Apply a realistic improvement rate. For most channels, a 10–20% improvement over a 90-day test period is achievable without a major budget change. Stretch targets (30%+) require either a significant budget increase or a structural change to the funnel.
Step 3: Use benchmarks as direction, not destination. A 30–50% marketing-sourced pipeline contribution is a common mid-market B2B benchmark, but your target depends on your deal size, GTM motion, and funnel maturity. Use published benchmarks to sense-check your targets, not to set them blindly.
Step 4: Pick the right timeframe.
- 30-day windows: active campaign optimization, creative testing
- 60–90 day windows: funnel experiments, landing page tests, new channel pilots
- Quarterly: strategic KPIs like CAC, LTV:CAC, marketing-sourced pipeline
- Annual: CLV, brand metrics, market share
Step 5: Get stakeholder sign-off with a short checklist.
- Is the baseline data validated and agreed upon?
- Is the target achievable given current budget and resources?
- Who owns the KPI and who reviews it?
- What is the escalation path if the KPI misses by more than 20%?
- Is there a defined testing window before the target is locked?
How to measure KPIs reliably with GA4, CRM, and your toolstack
Reliable measurement starts with one rule: every traffic source must be tagged, every conversion must be tracked, and every KPI must have a single documented data source.
Implementation checklist:
- Standardize UTM parameters across all campaigns (source, medium, campaign, content, term)
- Define GA4 events and conversion actions before any campaign goes live
- Map CRM fields to match GA4 and ad platform data (lead source, campaign name, MQL date)
- QA every GA4 conversion event in DebugView before reporting begins
- Document the attribution model in use for each KPI and review it quarterly
Tool roles in your measurement stack:
- GA4: Web behavior, conversion events, assisted conversions, engagement rate, traffic source attribution
- HubSpot or Salesforce: MQL volume, MQL-to-SQL rate, pipeline value, CAC (when integrated with finance)
- Google Ads / Meta Ads Manager: CTR, CPC, CPA, ROAS, impression share
- Looker Studio or Databox: Cross-channel KPI dashboards that pull from GA4, CRM, and ad platforms into one view
- Server-side tagging (via Google Tag Manager Server-Side or Segment): Improves data accuracy when browser-side tracking is blocked by ad blockers or iOS privacy changes
On attribution models: Last-click attribution is the easiest to implement but systematically undervalues upper-funnel channels like SEO and display. Data-driven attribution (available in GA4 and Google Ads) distributes credit based on actual conversion path data and is the most accurate model for most teams. Use first-click attribution only when you specifically want to understand which channel initiates the relationship. Whatever model you choose, document it in the KPI name and never switch models mid-reporting period without recalculating historical data.
KPI governance: who owns what and how to keep it honest
Assign a single owner to every KPI. Not a team, not a shared inbox — one named person who is responsible for the number, the data source, and the escalation path when performance drifts.
Ownership template fields to require for every KPI:
- KPI name and formula (exact, agreed version)
- Data source and tool
- Named owner
- Cross-functional reviewer (e.g., marketing + sales for MQL-to-SQL; marketing + finance for CAC)
- Reporting cadence
- Current target and baseline
- Escalation path if KPI misses by more than a defined threshold
Negotiating targets with stakeholders:
- Bring baseline evidence, not projections. Show the last 90 days of data before proposing a target.
- Model two scenarios: a realistic target and a stretch target, with the budget or resource difference spelled out.
- Build in a contingency clause for major market changes (budget cuts, algorithm updates, seasonality).
Red flags that signal a governance problem:
- Two teams report different values for the same KPI
- The formula for CAC or MQL-to-SQL has never been written down
- Attribution model changes mid-quarter without a data recalculation
- No one can name the owner of a KPI when asked in a meeting
A solid reporting cadence is the operational backbone of KPI governance. Weekly snapshots for active campaigns, monthly reviews for channel KPIs, and quarterly reviews for strategic KPIs like LTV:CAC and marketing-sourced pipeline.
Common KPI pitfalls and how to fix them fast
Most KPI failures come from the same handful of mistakes. Recognizing them early saves months of wasted reporting.
Pitfall 1: Tracking vanity metrics as KPIs. Total followers, raw impressions, and page views feel like progress. They rarely connect to revenue. Fix: for every metric on your dashboard, ask “if this number doubles but revenue stays flat, does it still matter?” If the answer is no, it is a vanity metric. Demote it to a monitoring metric or cut it entirely. Effectiveness KPIs tied to business outcomes always outrank volume metrics.
Pitfall 2: Too many KPIs. A dashboard with 25 KPIs means nothing is actually a priority. Fix: limit your active KPI set to five to eight core indicators. Everything else moves to a secondary monitoring view.
Pitfall 3: Inconsistent formulas. Marketing calculates CAC one way, finance calculates it another. Fix: document the formula once, get cross-functional sign-off, and publish it in a shared wiki or dashboard annotation.
Pitfall 4: Ignoring leading indicators. Teams that only track lagging KPIs (CAC, revenue) find out about problems after the quarter ends. Fix: pair every lagging KPI with at least one leading indicator that gives you a 30–60 day early warning.
Pitfall 5: Relying solely on last-click attribution. This model makes paid search look like a hero and makes SEO and email look like passengers. Fix: switch to data-driven attribution in GA4 for primary KPIs, and use assisted conversions to give upper-funnel channels fair credit.
When to drop a KPI: If a metric has not influenced a decision in three consecutive reporting periods, reclassify it as a monitoring metric. KPIs should drive action. If a number is just being watched, it is not doing its job.
Agency-tested KPI templates for B2B, local business, and ecommerce
These three templates are starting points. Tune the targets to your own baseline data.
Template 1: B2B lead generation
Primary KPI: MQL volume (target: a significant increase in MQLs over the first few months of a pilot)
Leading indicators:
- Website-to-MQL rate, targeting improvement over current performance
- Content download conversion rate, aiming to increase engagement
- Paid search CTR, with a goal to improve click-through rates
Lagging indicators:
- MQL-to-SQL conversion rate, seeking better lead qualification and sales alignment
- Marketing-sourced pipeline, aiming for a higher share of the total pipeline
Sample 90-day target calculation: If current monthly sessions and website-to-MQL rate improve, MQL volume increases accordingly without necessarily adding budget. Increasing both conversion rate and traffic will further raise MQL volume.
Dashboard sources: GA4 (traffic, conversion events), HubSpot (MQL volume, MQL-to-SQL, pipeline), Google Ads (CTR, CPA).
Template 2: Local small business (appointment or foot-traffic objective)
Primary KPI: Appointment bookings per month (target: a meaningful increase over a three-month period)
Leading indicators:
- Local organic sessions (Google Business Profile clicks + organic)
- Paid search conversion rate on appointment landing page
- Email click-to-booking rate (for existing customer list)
Lagging indicators:
- Cost per appointment (total paid + email spend / bookings)
- Repeat booking rate (retention signal)
Sample A/B test calculation: Run two versions of the appointment landing page for 30 days. If one version converts significantly better than the other, it produces noticeably more bookings at similar traffic levels. Apply the winning version and reset the baseline.
Dashboard sources: GA4, Google Ads, Google Business Profile Insights, email platform (Mailchimp, Klaviyo, or equivalent).
For local businesses, pairing these KPIs with a broader small business digital marketing strategy accelerates results significantly.
Template 3: Ecommerce KPI pack
Primary KPI: Conversion rate (target: improve conversion rate over a three-month timeframe)
Supporting KPIs:
- AOV (target: increase average order value through bundle offers)
- CAC (target: lower customer acquisition cost by improving return on ad spend on top-performing ad sets)
- ROAS (target: improve return on ad spend)
Worked example: At a given level of sessions and conversion rate, increasing conversion rate and average order value results in significant revenue growth without additional traffic spend.
Dashboard sources: GA4 (ecommerce events, conversion rate), Shopify or WooCommerce backend (AOV, revenue), Google Ads / Meta Ads Manager (ROAS, CPA).
Key Takeaways
Setting measurable digital marketing KPIs requires pairing three leading indicators with two lagging indicators for a single business objective, standardizing formulas across teams, and reviewing performance on a cadence short enough to act on the data.
| Point | Details |
|---|---|
| Start with five KPIs | Map three leading and two lagging indicators to one business objective before adding more. |
| SMART naming prevents disputes | Include channel, unit, period, attribution model, and data source in every KPI name. |
| Benchmarks are directional | A 30–50% marketing-sourced pipeline is a mid-market B2B reference point, not a universal target. |
| Governance requires a named owner | Every KPI needs one accountable person, a documented formula, and a defined escalation path. |
| Netco Design builds the framework | Netco Design implements KPI frameworks, GA4 tracking, and cross-channel dashboards for clients across Tampa Bay and beyond. |
The KPI mistake that costs teams the most time
The conventional wisdom on KPI setting focuses on choosing the right metrics. That is the wrong place to start. The real problem in most client engagements is not metric selection — it is formula disagreement. Marketing and sales are tracking the same KPI with different definitions, and no one realizes it until a quarterly review turns into a 90-minute argument about whose numbers are right.
The fix is not a better dashboard. It is a one-page formula document, signed off by marketing, sales, and finance before the first report is published. That document specifies exactly what counts as an MQL, exactly how CAC is calculated, and exactly which attribution model is in use. Once that exists, the dashboard becomes a tool for decisions instead of a source of conflict.
There is also a tendency to over-engineer the KPI set at the start. Teams want to track everything because everything feels important. The result is a 25-metric dashboard that no one acts on. The teams that move fastest are the ones that pick five to eight KPIs, own them completely, and add metrics only when a specific decision requires more data.
The SMART framework and the templates in this guide are not academic exercises. They are the operational scaffolding that makes marketing accountable to business outcomes — and that accountability is what earns marketing a seat at the revenue table.
Netco Design helps you build KPI frameworks that actually work
Most marketing teams know they need better KPIs. The gap is in the implementation: connecting GA4 to the CRM, standardizing formulas across departments, and building a dashboard that gives leadership a real-time view of what is working.

Netco Design handles that end-to-end for clients across Tampa Bay and beyond. The process starts with a baseline audit of your current tracking setup, identifies gaps in attribution and formula documentation, and builds a KPI framework aligned to your specific business objective. From there, the team implements GA4 event tracking, CRM integrations, and a one-page cross-channel dashboard. For teams that want to manage KPIs in-house, Netco Design also offers customized training so your team can own the process confidently.
If you are a startup or small business ready to move from guesswork to a structured KPI system, the digital marketing strategies for startups page is a practical next step. To discuss a KPI audit and dashboard build for your business, reach out to Netco Design directly at netcodesign.com.
Useful sources and further reading
- What Are SMART KPIs? And How Do You Track Them? — AgencyAnalytics: Practical breakdown of the SMART framework applied to marketing KPIs, with example phrasing and tracking guidance.
- B2B Marketing KPI: What It Is, How to Measure It, and Why It Matters — Sona: Covers leading vs. lagging indicator structure, benchmark ranges for marketing-sourced pipeline, and the case for standardized formulas.
- 3 B2B Marketing KPIs to Measure Marketing With B2C Metrics — Leadfeeder: Explains why account-level KPIs outperform volume metrics for B2B teams and outlines the top KPIs high-performing B2B teams track.
- Setting SMART Goals and KPIs in Digital Marketing — Pimbal Technology: Step-by-step examples of SMART goals tied to channel tactics, with guidance on short feedback loops and diagnostic use of KPIs.
- Choosing Effective Digital Marketing KPIs — Smart Insights: Guidance on separating effectiveness KPIs from efficiency KPIs and avoiding the vanity metric trap.
- 7 Marketing KPIs You Should Know and How to Measure Them — Harvard Business School Online: Authoritative overview of core marketing KPIs with definitions and measurement context from HBS faculty.
- Marketing KPI Examples — Netco Design: Practical KPI definitions and examples organized by channel and objective, useful as a reference alongside this guide.
FAQ
What is an example of a KPI in digital marketing?
A clear example is MQL-to-SQL conversion rate: the percentage of marketing-qualified leads that sales accepts and advances, calculated as (SQLs / MQLs) × 100. It is a KPI because it is tied directly to pipeline growth and has a defined target and owner.
What does KPI mean in digital marketing?
KPI stands for key performance indicator — a quantifiable measure linked to a specific business outcome, such as revenue, retention, or pipeline growth. Unlike a general metric, a KPI has a target, an owner, and a reporting cadence.
What is the SMART framework for marketing KPIs?
SMART stands for Specific, Measurable, Achievable, Relevant, and Time-bound. A SMART KPI example: “Increase paid search ROAS by a realistic percentage by the end of Q3, measured in Google Ads using last-click attribution.”
What are the 4 P’s of KPI?
The “4 P’s of KPI” is not a standard industry framework. A widely used alternative is the SMART criteria, which ensures every KPI is Specific, Measurable, Achievable, Relevant, and Time-bound — the structure most marketing teams and agencies, including Netco Design, apply when defining trackable goals.
How many KPIs should a digital marketing team track?
Five to eight core KPIs is the practical limit for most teams. Beyond that, no single metric gets the attention it needs. Pair three leading indicators with two lagging indicators for your primary objective, then add channel-specific supporting metrics only when a specific decision requires them.
Recommended
- Top 10 Marketing KPI Examples to Track in 2026 – Netco Design LLC
- Digital Marketing Reporting Checklist for 2026 – Netco Design LLC
- 10 Actionable Digital Marketing Tips for Small Business Success in 2026 – Netco Design LLC
- 7 Actionable Marketing Dashboard Examples to Track Your ROI in 2026 – Netco Design LLC

