

table of contents
An SEO report is your website’s regular health check, translating a bunch of complex performance data into a clear, simple story. It’s built to answer one fundamental question: how are we actually doing in search engines? Instead of just spitting out visitor numbers, a good report reveals how people are finding your site, which keywords they’re using, and whether your online presence is helping you hit your business goals.
Your Digital Scorecard: What Is an SEO Report?
Think of an SEO report as a digital scorecard for your business. It’s not just a jumble of charts and numbers; it’s a narrative that explains what’s working, what isn’t, and where your biggest opportunities for growth are hiding. This is the document that shifts your marketing from guesswork to a data-driven strategy.
Without this crucial feedback, you’re essentially flying blind. You might be creating fantastic content or making tweaks to your website, but you’ll have no real idea if those efforts are moving the needle. An SEO report delivers the clarity you need to make smart, informed decisions.
Measuring What Matters Most
At its core, the purpose of an SEO report is to measure your progress against specific goals. It’s the tool that connects your day-to-day SEO activities directly to real business outcomes, giving you a clear picture of your performance.
To do this, it focuses on key metrics. These reports mix raw numbers like sessions and impressions with percentages like click-through rates, and most importantly, they show you how things are trending over time. A solid SEO report is a quantitative snapshot showing how a website performs and why, making it essential for justifying your investment. Industry data consistently shows that organic search drives around 33% of all website traffic across major sectors, and insights from these reports are what help you tap into that.
Transforming Data Into Actionable Insights
A great report doesn’t just throw data at you; it interprets it. For instance, seeing a drop in traffic is one thing. But understanding that the drop happened because a competitor just outranked you for three of your most valuable keywords? That’s an actionable insight.
An SEO report is the bridge between your marketing efforts and your business results. It’s the tool that proves your strategy is working and highlights exactly where to focus your resources for maximum impact.
This is the real value of consistent reporting. It provides the context needed to understand your performance and guides your next steps. By analyzing these scorecards, you can pinpoint weaknesses, double down on what’s already working, and steadily improve your online visibility. This process is a fundamental part of any strong digital marketing plan. You can learn more about the foundations by reading our guide on what search engine optimization is.
The Four Pillars of a Powerful SEO Report
A truly effective SEO report isn’t just a jumble of numbers; it’s a story about your online performance. To tell that story clearly, every great report is built on four essential pillars. Think of them as the non-negotiable chapters that, when read together, transform raw data into a clear narrative of your digital health and a roadmap for what to do next.
When you understand these pillars, the entire report clicks into place. It stops being an intimidating spreadsheet and becomes a strategic guide, with each section answering a different—but equally critical—question about how your website is performing and where your biggest opportunities are hiding.
At its core, an SEO report is designed to drive growth through a simple, three-step process.
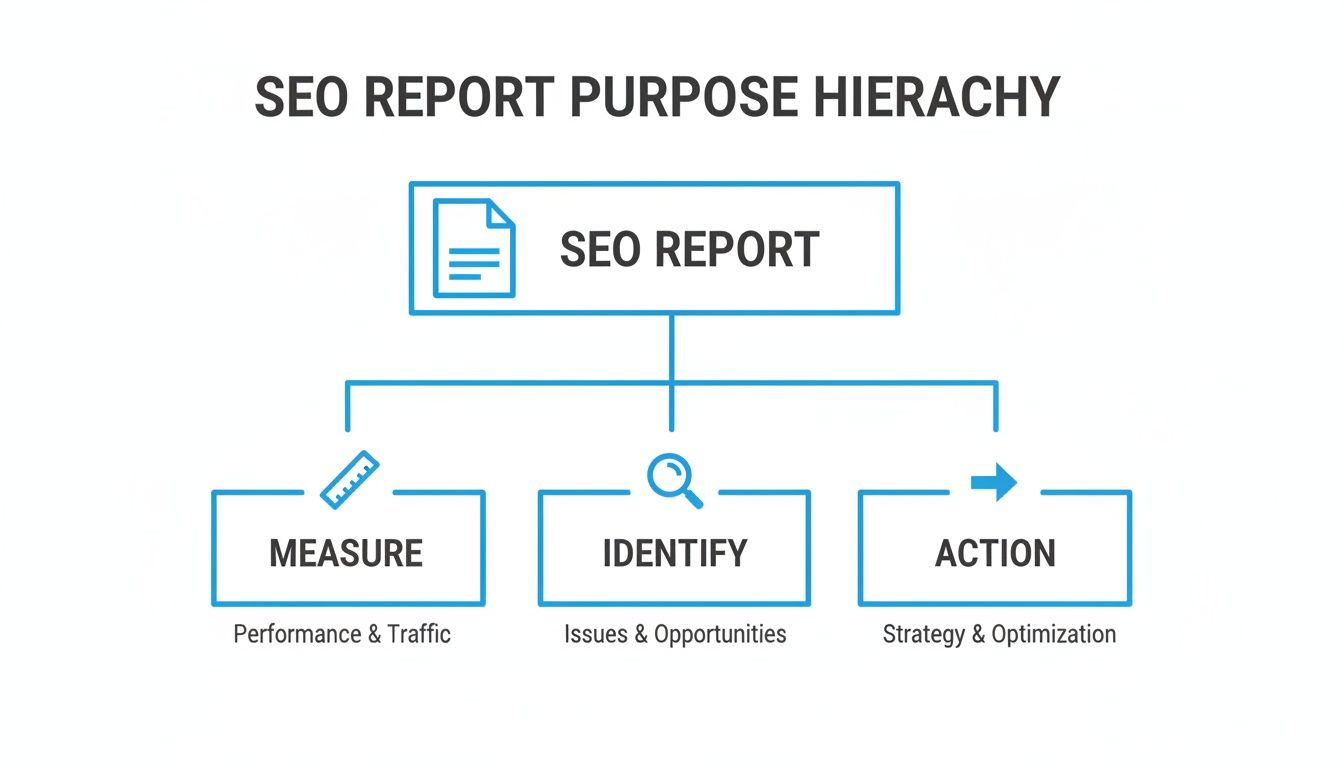
The whole point is to first measure what’s happening, then identify what’s working (and what’s not), and finally, take meaningful action to get better results.
Pillar 1: Traffic and Engagement
The first and most fundamental pillar is Traffic and Engagement. It answers the big question: “Who is actually visiting our site, and what do they do once they get here?” This is the bedrock of your report. Without people coming to your site, the other pillars don’t have much to stand on.
We’re looking at metrics like organic sessions (how many visits you get from unpaid search results) and user behavior signals like bounce rate or time on page. Seeing a ton of traffic but terrible engagement could mean you’re ranking for the wrong keywords—you’re attracting clicks, but your content isn’t delivering what those visitors actually wanted.
On the flip side, low traffic but amazing engagement might tell you that you’re attracting the perfect audience, you just need to find more of them. This pillar helps you understand not just how many people are showing up, but whether they’re the right people.
Pillar 2: Visibility and Rankings
Next up is Visibility and Rankings. This pillar gets straight to the point, answering: “How easy is it for potential customers to find us on Google?” This is where you see exactly how you’re stacking up against the competition for the search terms that matter most to your business.
This section of the report will almost always include:
- Keyword Rankings: Your specific position on Google for your most important search terms.
- Search Visibility: An overall score that represents your “market share” of clicks for your tracked keywords.
- Impressions: The total number of times your pages appeared in search results, even if they weren’t clicked.
Watching your rankings for high-value keywords steadily climb is one of the clearest signs your SEO strategy is paying off. It’s direct proof that Google is starting to see your site as a relevant, authoritative answer for what your customers are searching for.
Pillar 3: Authority and Backlinks
The third pillar, Authority and Backlinks, is all about your website’s reputation across the internet. You can think of it as your online credibility score. It answers the question: “Do other reputable websites trust and vouch for our content?”
Search engines like Google view backlinks—links pointing from other sites to yours—as votes of confidence. But here, quality absolutely crushes quantity.
A single backlink from a highly respected industry website is often more valuable than dozens of links from low-quality, irrelevant sites. This pillar is about building digital trust that translates directly into higher search rankings.
Your SEO report will break down your backlink profile, showing you new links you’ve earned, links you’ve lost, and the overall authority of your website. A healthy, growing backlink profile sends a powerful signal that your site is a trusted resource worth showing to more people.
Pillar 4: Technical Health
Finally, we have Technical Health. This is the pillar that makes sure your website is a well-oiled machine for both people and search engine crawlers. It asks: “Is our website easy for search engines to understand and for people to use?”
You could be doing everything else right, but technical issues can bring it all crashing down. Things like slow page speed, a site that isn’t mobile-friendly, or a bunch of broken links create a terrible user experience. That causes visitors to leave and signals to Google that your site isn’t worth ranking highly.
Monitoring your site’s technical health is like getting routine maintenance on your car. It’s all about catching the small issues before they become massive problems that grind your performance to a halt.
How to Read an SEO Report and Find the Story

Let’s be honest: data without a story is just a pile of numbers. The real magic of an SEO report isn’t in the raw data itself, but in learning how to read it like a detective. You’re looking for clues, connecting the dots, and uncovering the bigger picture of what’s happening with your online presence.
Instead of getting hung up on one metric, your goal is to spot trends, patterns, and cause-and-effect relationships. Think of it like putting together a puzzle. A 10% drop in organic traffic this month might feel like a reason to panic. But when you connect it to another piece—like a sudden dip in keyword rankings for your top service—the picture starts coming into focus.
Connecting Metrics to Business Outcomes
The most valuable insights are born when you link SEO performance directly to your bottom line. A great report doesn’t just show you what happened online; it explains how that activity is impacting your actual business.
Imagine a local plumbing company in St. Petersburg. Their latest report shows that their ranking for “emergency plumber St Pete” slipped from position #3 to #8. On its own, that’s just a number. But the story unfolds when you connect the dots:
- Observation: Keyword rankings for a critical, high-intent search term have dropped.
- Correlation: Organic traffic from local search queries decreased by 20% during the same time frame.
- Business Impact: The team at the front desk mentions a noticeable drop in calls for emergency service.
Suddenly, that ranking drop isn’t some abstract SEO issue; it’s a direct hit to the company’s revenue. This is the kind of narrative that turns a report from a simple document into a powerful tool for action. Understanding the basics of how to check keyword ranking is the first step toward diagnosing problems like this.
Looking for Trends Over Time
An SEO report isn’t a one-time snapshot—it’s a chapter in an ongoing story. Its true value comes from comparing performance over time to see where things are headed. Don’t make knee-jerk decisions based on a single day or week of data; small ups and downs are perfectly normal.
Instead, zoom out. Is your organic traffic on a steady upward climb month after month? Are you earning more new backlinks each quarter than the last? These long-term trends tell you far more about your strategy’s health than any short-term blip.
The goal is to move beyond isolated numbers and understand the narrative they’re telling together. An SEO report should empower you to ask smarter questions, spot opportunities, and make decisions that drive real growth.
Of course, finding that story is a lot easier when the data is presented clearly. For a report to be truly useful, it needs effective data visualization. Check out these data visualization best practices for clear reports to learn how to present information for maximum impact, making it simple for anyone to grasp the key takeaways.
A Scenario for an E-commerce Store
Let’s apply this same storytelling approach to an e-commerce brand. An online shop selling handmade leather goods notices that a blog post, “How to Care for Your Leather Bag,” is now ranking on the first page of Google.
- Initial Metric: The blog post hit position #5 for its main keyword.
- Deeper Insight: This one post is now bringing in 1,500 new organic visitors every month.
- The Story: A big chunk of those visitors are clicking from the blog post over to the product pages for leather care kits.
- Business Result: The report shows this single article has directly led to a $2,500 increase in monthly sales for those specific products.
This is the kind of story an SEO report should tell. It connects the dots from content creation all the way to revenue, proving the value of your efforts and giving you a clear roadmap for what to do next. When you learn to find these narratives, you can start making smarter, more profitable decisions.
Choosing the Right Tools for SEO Reporting
You can’t create an accurate SEO report without reliable data. Think of it like a doctor trying to diagnose a patient without any medical instruments—you’re just guessing. The right SEO tools are your instruments, and they’re essential for gathering the precise metrics that make a report truly meaningful.
Fortunately, you don’t need a massive budget to get your hands on the most important data. The foundational platforms are completely free and give you a goldmine of information about your website’s performance. For any business serious about its online presence, these are non-negotiable.
Foundational Free Platforms
Every single business should start with Google’s own powerful, free tools. They offer a direct line of sight into how the world’s biggest search engine sees your site and what people do once they get there.
- Google Analytics: This is your go-to for understanding website traffic and user behavior. It answers questions like, “How many people found us through organic search last month?” and “Which pages are the most popular?” It tells you the “what” of your website’s performance.
- Google Search Console: This tool is all about your website’s relationship with Google Search. It keeps an eye on your search performance, indexing status, and technical health. It answers questions like, “What keywords are we actually showing up for?” and “Are there any glitches preventing Google from crawling our pages?” This is the “how” and “why” of your search visibility.
These two platforms are a perfect pair. Analytics shows you what users do on your site, while Search Console reveals how they found you in the first place.
Advanced Paid Platforms
While Google’s tools are the perfect starting point, paid platforms give you a serious competitive edge. These all-in-one toolkits offer deeper insights that are hard, if not impossible, to get for free—especially when you want to peek at what your competitors are doing. To build a truly comprehensive report, it helps to have the right tools, and you can discover some of the best free SEO audit tools if you’re looking for some cost-effective options to get started.
Industry-standard platforms like Semrush, Ahrefs, and Moz take your reporting to a whole new level by filling in the gaps left by free tools.
Think of these advanced tools as an X-ray of your competitors’ strategies. They let you see the exact keywords driving their traffic and which websites are linking to them, handing you a clear roadmap for how to compete.
Paid tools are particularly great at providing advanced data for:
- Competitive Analysis: See what keywords your competitors rank for and how much traffic they’re getting. This is how you spot holes in your own strategy.
- Backlink Audits: Analyze your own backlink profile and uncover new link-building opportunities by seeing who links to your rivals. A big part of this process is taking a deep dive into your site’s overall health, and our guide on how to perform an SEO audit walks you through those exact steps.
- Advanced Rank Tracking: Monitor your keyword rankings with much greater accuracy, tracking different locations or devices to get more granular detail for your report.
Ultimately, the best toolset comes down to your specific needs and budget. Starting with the free Google platforms is a must. As your strategy gets more serious, investing in a paid tool can deliver the advanced insights you need to outmaneuver the competition.
Turning SEO Insights Into a Winning Action Plan

Here’s the thing about SEO reports: the real magic isn’t in the data itself, but in the action it inspires. A report that just collects dust in your inbox is a massive missed opportunity. To turn it from a static document into a roadmap for growth, you need a simple way to translate those numbers and charts into a real-world plan.
This isn’t about getting lost in spreadsheets. It’s about connecting what the numbers are telling you with what your business needs to do next.
The Observation Insight Action Model
The best way to turn a report into a plan is with the Observation, Insight, Action model. It’s a straightforward, three-step process that forces you to dig deeper than the surface-level metrics and uncover the story behind the data.
Here’s how it breaks down:
- Observation: Start with a specific fact pulled directly from the report. This is the “what.” For example, “Organic traffic to our top three service pages dropped by 15% this month.”
- Insight: Now, explain what that fact actually means for your business. This is the “so what?” For instance, “This dip suggests we’re losing ground for our most important keywords, which could hit our lead generation hard.”
- Action: Finally, outline the clear, specific next step you’ll take. This is the “now what?” For example, “We need to analyze the keyword rankings for these pages and see what our competitors are doing differently.”
This simple framework makes sure you never walk away from a data review without a clear directive. It’s a repeatable process that moves you from spotting a problem to mapping out the solution.
Every metric in your SEO report should be a starting point for a conversation about what to do next. Data is the diagnosis; the action plan is the treatment.
Using this model keeps you from getting bogged down in the numbers. It shifts the focus from just tracking metrics to actually using them to make smarter decisions that drive real results.
Practical Scenarios and Next Steps
Let’s walk through how this model works in the real world with a couple of common scenarios you might find in your next report. You’ll see how different observations lead to completely different plans.
First, imagine your report shows a sudden, scary drop in overall organic traffic. This is a red flag that calls for immediate investigation.
Observation: Total organic traffic fell by 30% last week.
Insight: A sharp drop like this usually points to a technical glitch, like pages getting de-indexed, or a major Google algorithm update that didn’t go in our favor.
Action Plan:
- Check Google Search Console: The first stop. Look for manual penalties or security warnings.
- Review Indexing: Make sure your most important pages are still visible to Google.
- Dig into Page-Level Data: Find out which specific pages lost the most traffic to pinpoint the source of the problem.
A traffic drop feels alarming, but a methodical approach helps you find the root cause fast. If you need more ideas, our guide on how to increase organic search traffic offers a ton of strategies.
Now for a different kind of problem: people are landing on your key pages but leaving right away.
Observation: The bounce rate on our main service page is a whopping 85%.
Insight: Visitors are finding us, but the page isn’t giving them what they want. Either it’s a bad user experience, or the content doesn’t match what they searched for.
Action Plan:
- Test Page Speed: Slow-loading pages are a top reason for high bounce rates. Use a tool like Google PageSpeed Insights to see if you have a problem.
- Review Above-the-Fold Content: Does the headline and opening paragraph instantly confirm visitors are in the right place? It needs to.
- Check Mobile Usability: Make sure the page is easy to read and navigate on a smartphone, where bounce rates are often higher.
By turning every key finding from your report into a clear set of next steps, you ensure your reporting process isn’t just about looking back—it’s about moving forward.
Frequently Asked Questions About SEO Reports
Even after you’ve got the basics down, a few practical questions always pop up when you start digging into SEO reports. Let’s tackle some of the most common ones to help you navigate the whole process with a bit more confidence.
How Often Should I Run an SEO Report?
For most businesses, a monthly SEO report is the sweet spot. This schedule is frequent enough to spot important trends and measure your progress, but not so often that you get lost in the normal, day-to-day noise of search data.
While monthly is the standard, other timelines can make sense too:
- Weekly Reports: These are perfect for keeping a close eye on short-term campaigns or tracking the immediate fallout from a big website update.
- Quarterly Reports: Use these for high-level strategy meetings. They let you zoom out and focus on the bigger picture, like long-term growth and ROI.
The most important thing? Consistency. Sticking to a regular schedule is the only way you can make fair comparisons over time and really figure out what’s moving the needle.
What Is the Difference Between an SEO Report and an SEO Audit?
It’s easy to mix these two up, but they have very different jobs. I like to use a doctor’s visit analogy.
An SEO report is like your regular check-up. It tracks your vital signs—traffic, conversions, rankings—over a set period to see how you’re doing and make sure your strategy is working as it should.
An SEO audit, on the other hand, is a deep-dive diagnostic. It’s like getting a full physical with bloodwork and scans to uncover every single underlying issue and opportunity across your entire website. It’s a one-time thing.
In short: the audit gives you the initial game plan, and the reports show you how well that plan is working month after month.
What Red Flags Should I Look for in a Report?
A good SEO report should bring clarity, not confusion. Be skeptical of reports that only show off “vanity metrics,” like high rankings for keywords nobody is actually searching for, without tying them back to what really matters: leads and sales. Many of the technical terms can feel overwhelming, but learning how to understand SEO without the jargon can help you spot these issues more easily.
Another huge red flag is a lack of transparency. If a report doesn’t clearly explain where the data is coming from, you can’t really trust its conclusions.
Finally, run from any report that just dumps data on you without any real analysis or actionable advice. A valuable report doesn’t just show you numbers; it tells you what they mean and what you should do next to get better results.
At Netco Design LLC, we create clear, actionable SEO reports that connect directly to your business goals. Contact us today to learn how our data-driven strategies can help you grow.

